 |
|
Biography
Stanislav Tyaginov was born in Leningrad (now Saint-Petersburg) in 1978. He received his MSc degree in physics (specialization: the physics of semiconductors) in 2002 and his doctoral degree in physics in 2006 (his PhD was devoted to the problem of the impact of insulator thickness non-uniformities on MOS tunnel structure characteristics). He joined the Institute for Microelectronics in January 2008 as a post-doc researcher. His scientific interests include the modeling of HCI-related degradation and TDDB as well as tunneling phenomena in MOS devices.
Hot-Carrier Degradation Modeling of Decananometer nMOSFETs Using the Drift-Diffusion Approach
Hot-carrier degradation (HCD) is a rather complex phenomenon and its physical modeling should be based on thorough carrier transport simulations. However, solving the Boltzmann transport equation (BTE) is a challenging task, one which is often avoided during HCD modeling. A good trade-off between computational efficiency and accuracy can be achieved by using the drift-diffusion (DD) scheme. In one of our recent papers, we have already demonstrated the applicability of the DD scheme for HCD modeling in high-voltage devices. In the case of decananometer MOSFETs, however, electron-electron scattering (EES) plays an important role. We have therefore extended our DD-based HCD model to decananometer devices and have paid special attention to the effect of EES on the carrier distribution functions (DFs).
The reference electron DFs have been obtained with the deterministic BTE solver, ViennaSHE, for three different devices of the same architecture, with SiON as the gate dielectric but with different gate lengths of 65, 150 and 300 nm for Vgs = Vds = 1.8 and 2.0 V (see Fig. 1). These complicated DFs can be approximated by an empirical expression that considers the population of hot and cold carriers. The shape of the DFs is controlled by two knee energies Ek,1 and Ek,2. The first knee energy determines the end of the plateau visible on DFs at moderate energies, and the second one defines the position of the onset of the EES hump (see Fig. 2). The value of Ek,1 is calculated using an empirical expression, while the parameter Ek,2 is obtained by balancing the in-scattering (i.e. EES) and out-scattering rates (i.e. interactions with phonons and ionized impurities).
DFs simulated with the analytic approach and ViennaSHE for 65, 150 and 300 nm devices at room temperature are shown in Fig. 1 and very good agreement is achieved. In order to check the validity of our approach in more detail, we calculated interface densities as functions of the x coordinate along the Si/SiON interface and changes of the linear drain current vs. stress time ΔId,lin(t) (see Fig. 3). In both cases, good agreement was found between results calculated using DFs from the thorough solution of the BTE and those computed with the DD-based analytical formula. We also compared Ek,2(x) profiles extracted from DFs evaluated using ViennaSHE with Ek,2(x) dependences from the rate balance equation. Good consistency of these results suggests that balancing in-scattering and out-scattering rates is a reliable method that allows one to describe the impact of EES on DFs.
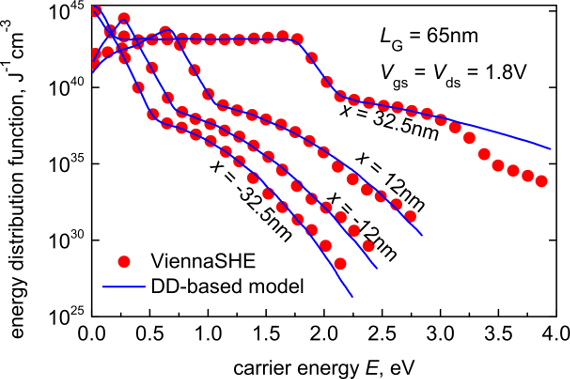
Fig. 1: Electron energy distribution functions calculated with ViennaSHE and our DD-based model for the 65 nm nMOSFET stressed at Vgs = Vds = 1.8 V. The DFs are plotted for different positions in the device (drain corresponds to x = 32.5 nm).
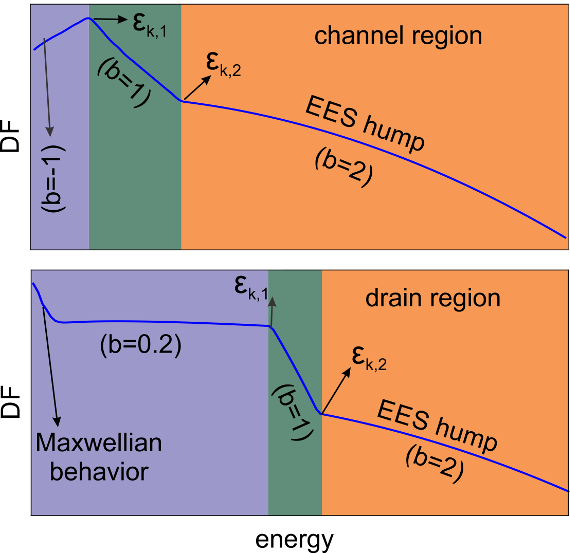
Fig. 2: A schematic representation of the carrier DF for the channel region (upper panel) and the drain region, with knee energies Ek,1 and Ek,2 shown.
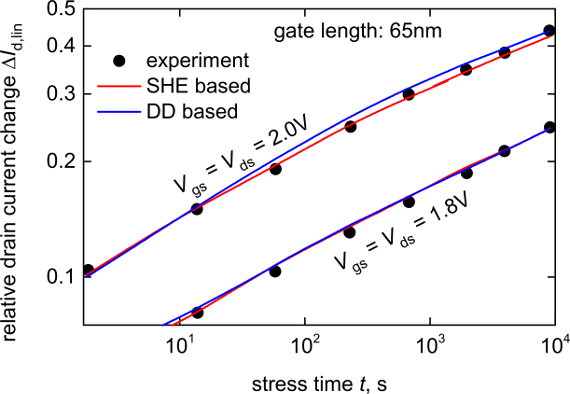
Fig. 3: Comparison of the experimental and simulated dependencies on the relative changes of the linear drain current, ΔId,lin, on stress time, t, for two combinations of stress voltages, Vgs = Vds = 1.8 and 2.0 V. One can see that agreement between measurement and theoretical data is very good. Moreover, different versions of our HCD model (i.e. those based on DFs obtained with ViennaSHE and generated by the DD-based method) lead to almost identical results.