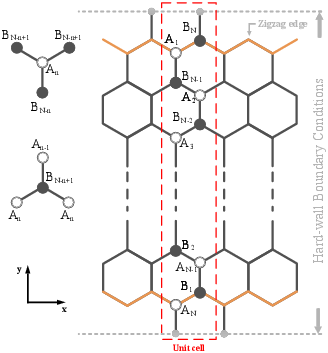
| Figure 4.1: The structure of a GNR with zigzag edges along the x direction. Each unit cell consists of N atomes at the sublattice A or B. A hard wall boundary condition is imposed on the both edges. |


The energy band structure of AGNRs can be obtained by making the transverse wavenumber discrete, in accordance with the edge boundary condition, which is analogous to the case of carbon nanotubes where periodic boundary conditions apply [172]. An analytical model for the dispersion relation and the wave functions of AGNRs is presented in Ref. [168]. However, because in ZGNRs the transverse wavenumber depends not only on the ribbon width but also on the longitudinal wavenumber, the energy band structure cannot be obtained simply by slicing the bulk graphene band structure. Therefore, exact analytical models can not be derived for ZGNRs [172]. In this chapter, we present two approximations for the wavenumber of ZGNRs which result in simple analytical expressions for band-structure and wave functions. We show that the analytical model is valid for a wide range of GNR indices.
The structure of graphene consists of two types of sublattices A and B, see Fig. 4.1.

Figure 4.1: The structure of a GNR with zigzag edges along the x direction. Each unit cell consists of N atomes at the sublattice A or B. A hard wall boundary condition is imposed on the both edges.
We start with the Hamiltonian (Eq. 6) and wave functions (Eq. 18 and Eq. 19) of graphene and derive the analytical expressions for ZGNRs.
To obtain φp in wave functions | ψA | and | ψB |, one can substitute the ansatz for the wave functions into the Schrödinger equation. An A-type carbon atom at some atomic site n has one B-type atom at some atomic site N−n and two B-type neighbors at N−n+1, see Fig. 4.1:
| ⎧ ⎨ ⎩ |
| (1) |
replacing the index n with n+1 in the second relation of Eq. 1, one obtains:
| φN−nB = (1/E)(t φnA + tf φn+1A). (2) |
Substituting this relation in Eq. 1 one can rewrite Eq. 1 as:
| C φnA = φn+1A + φn−1A , (3) |
with:
| C = |
| and f = 2cos(k.a/2) = 2cos | ⎛ ⎜ ⎜ ⎝ |
| kx acc | ⎞ ⎟ ⎟ ⎠ | . (4) |
Due to symmetry, a similar relation holds for the B-type carbon atoms:
| C φnB = φn+1B + φn−1B . (5) |
Considering the boundary condition φ0A=φ0B=0, the solution to the recursive formula is given by (see Appendix B.2):
| . (6) |
Depending on the values of C, Eq. 4 can have three different solutions. For |C|>2, φnB has a hyperbolic solution where the wave function is localized at the edges of the ribbon:
| φnB = |
| φ1B , (7) |
where θ is given by:
| C=2cosh(θ). (8) |
For C=±2, the amplitude of the wave function increases linearly with n. This critical case appears at the transition point from localized states to delocalized states. For |C|<2 , √C2−4 is a pure imaginary number. The solution φnB is, therefore, given by:
| φnB = |
| φ1B (9) |
| φnB = |
| φ1B= |
| φ1B , (10) |
where θ is the wavenumber and is given by
| C=2cos(θ). (11) |
Under this condition the wave function has an oscillatory behavior and is not localized.
The prefactors CA and CB in Eq. 18 are found to be CA=± CB, see Appendix B.1. To simplify the equations we assume φ1A/B=sin(θ).
Therefore, the wave functions become
| | ψ ⟩ = |
|
| eikx xnAsin(nθ) | An ⟩ ± |
|
| eikx xnBsin(nθ) | Bn ⟩. (12) |
To obtain the normalization factor Ω, one has to impose the following condition [168] in the Eq. 19:
| ⟨ ψA | ψA ⟩ = ⟨ ψB | ψB ⟩ = 1/2. (13) |
By substuting Eq. 12 in Eq. 13 one obtains
| ⟨ ψA | ψA ⟩= |
|
| ⎛ ⎜ ⎜ ⎜ ⎝ | sin2(nθ) | ⎞ ⎟ ⎟ ⎟ ⎠ | =1/2. (14) |
It is straightforward to obtain ΩA/B=Ω as
| (15) |
In principle θ can not be derived analytically for ZGNRs. However, two approximations for θ are discussed in Sec. 4.2. Using the analytical approximated θ calculated in Eq. 28, Eq. 15 can be simplified as
| Ω = N + 1/2. (16) |
In order to obtain the respective energy spectrum, Eq. 4 can be written as
| E = ± t | ⎡ ⎣ | Cf + f2 + 1 | ⎤ ⎦ | 1/2. (17) |
By substituting Eq. 4 and Eq. 11 in Eq. 17, the energy dispersion relation takes the form
| E = ± t | ⎡ ⎢ ⎢ ⎣ | 1+4cos2 | ⎛ ⎜ ⎜ ⎝ |
| kx acc | ⎞ ⎟ ⎟ ⎠ | +4cos | ⎛ ⎜ ⎜ ⎝ |
| kx acc | ⎞ ⎟ ⎟ ⎠ | cos | ⎛ ⎝ | θ | ⎞ ⎠ | ⎤ ⎥ ⎥ ⎦ |
| . (18) |
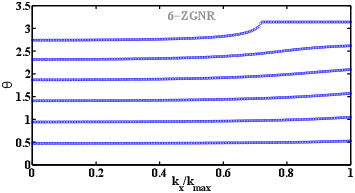
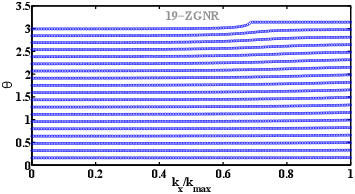
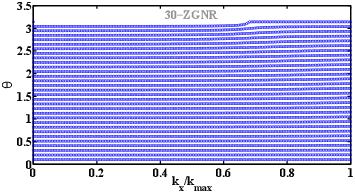
Figure 4.2: Numerically evaluated the wavenumber θ as a function of kx for 6-ZGNR, 19-ZGNR, and 30-ZGNR.
In the following, the relation between θ and kx is obtained. Setting n=N+1 in Eq. 1 gives
| E φ0B = t φNA + 2t cos | ⎛ ⎜ ⎜ ⎝ |
| kx acc | ⎞ ⎟ ⎟ ⎠ | φN+1A. (19) |
On the other hand the wave functions for n = N and n = N + 1 are given by Eq. 10
| (20) |
By imposing a hardwall boundary condition, φ0B=0, Eq. 19 can be rewritten as
| t |
| φ1A + 2t cos | ⎛ ⎜ ⎜ ⎝ |
| kx acc | ⎞ ⎟ ⎟ ⎠ |
| φ1A = 0, (21) |
and we obtain the quantization condition,
| = −2 cos | ⎛ ⎜ ⎜ ⎝ |
| kx acc | ⎞ ⎟ ⎟ ⎠ | . (22) |
From Eq. 22, θ can be extracted and used in the analytical derivation of the wave functions and energy dispersion relation of ZGNRs. Figure 4.2 shows the variation of θ as a function of kx for different subbands.
As can be seen, a weak dependency exists between θ and kx. However, we assume a constant θ with respect to kx, so the right hand side of Eq. 22 becomes a constant. At this point, two approaches exist to simplify Eq. 22 based on choosing kx. In general, using all kx in the range of [0,π/√3acc] except kx = 2π/3√3acc results in non analytical solution and curve fitting is required to extract θ. This approach is first discussed. For kx = 0, Eq. 22 can be written as
| = −2. (23) |
Using curve fitting one finds
| θ = |
| = | ⎧ ⎨ ⎩ |
| (24) |
where υ is related to the subband number q (q=2υ) and N is the index of ZGNR. p1, p2, p1′ and p2′ are fitting factors. Performing a fit for the range of N∈[6,100],
| (25) |
Figure 4.3 compares θ obtained from Eq. 25 with exact numerical results.
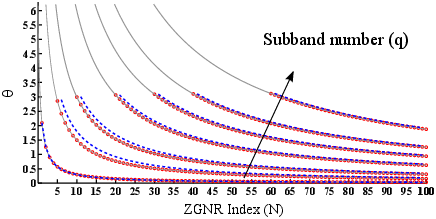
Figure 4.3: The wavenumber θ as a function of the ribbon index, N, for different subband numbers, q. Dashed lines show the first approximation (Eq. 25) and circles show the second approximation (Eq. 28).
Another approach for approximating θ is selecting kx=2π/3√3acc which makes the right side of Eq. 22 equal to −1
| (26) |
and has the following solution
| θ = |
| . (27) |
By representing υ in terms of subband index q, θ is obtained as a function of q and N,
| θ = |
| . (28) |
Figure 4.3 compares the discussed approximations with exact numerical results. The value of θ for Eq. 28 shows a good agreement with that obtained from numerical calculations. The approximation is valid for a wide range of ZGNR indices. Using the analytical expression for θ, analytical wave functions and energy dispersion are evaluated from Eq. 12 and Eq. 18. The results for a 6-ZGNR and a 19-ZGNR are shown in Fig. 4.4 and Fig. 4.5, respectively.
Optical transition rules can be obtained from the optical matrix elements. The interband optical matrix element determines the probability for a transition from a state | m ⟩ to a final state | n ⟩ and is given by (q/m0)⟨ n |A·p | m ⟩, [150] where q is the elementary charge, m0 is the electron mass, A=A a is the vector potential, a is a unit vector parallel to A, and p is the linear momentum operator. The vector potential can be separated from the expectation value assuming the wave vector of the electromagnetic field is negligible compared to the electronic wave vector (dipole approximation). We have already used this approximation to derive the electron-photon interaction Hamiltonian (Eq. 10). As a result, optical matrix elements can be achieved by evaluating momentum matrix elements pn,m=⟨ n| px| m ⟩. In this work the electromagnetic field is assumed to be polarized along the x direction.
Knowing the wave function of atomic orbitals, [173] the matrix elements of the momentum operator can be calculated from Eq. 13. However, in most of the tight-binding models the atomic orbitals are unknown, a difficulty which is usually circumvented by the gradient approximation [162], see Sec. 3.1.3. In this approximation intra-atomic transitions are ignored. However, as we employ a single orbital model to describe the electronic band-structure of ZGNRs, intra-atomic transitions are intrinsically neglected.
With the wave functions derived in the previous section, evaluation of transition rules from Eq. 13 is possible. Using the wave functions from Eq. 12 in Eq. 13, and considering only nearest neighbors, one can obtain (see Appendix B.3)
| (29) |
The upper limit of summation 2N is due to degenerate points of valance and conduction bands at kx=±2π/3√3acc. The subband indices are included in θ and θ′, see Eq. 28. The summation over sine functions in Eq. 29 determines the transition rules. By some trigonometric identities one can rewrite this summation as follows
Using the analytical approximation of θ in Eq. 28 for the cosine terms in Eq. 30 gives
| (31) |
If q=2r+1 and q′=2r′ or q=2r and q′=2r′+1 , where r and r′ are non-zero integers, q± q′=2r″+1, both terms in the bracket of Eq. 30 will be zero. In the case of q=2r and q′=2r′ or q=2r+1 and q′=2r′+1, the terms in the bracket will be non zero. Therefore, the transitions between valence and conduction subbands only with the same parity (odd to odd and even to even) are allowed,
| Pθ,θ′ = Pq,q′ = | ⎧ ⎨ ⎩ |
| (32) |
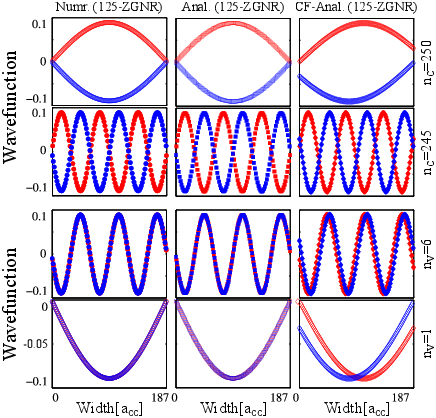
Figure 4.6: The wave functions of 125-ZGNR. Red(Blue) symbols denote the wave functions at the sublattice B(A). The analytical model (squares) and curve fitted model (diamonds), are compared against the numerical results (circles) for different subbands.
In this section, the energy dispersion relation and the wave functions for the approximated discrete wavenumbers θ are evaluated and compared against exact numerical calculations. Eq. 28 is employed to give the wave functions and energy dispersions from Eq. 12 and Eq. 18, respectively. Based on the structure depicted in Fig. 4.1, the width of a zigzag nanoribbon is given by
| W= | ⎛ ⎜ ⎜ ⎝ |
| +1 | ⎞ ⎟ ⎟ ⎠ | acc, (33) |
where acc=1.42 Å is the carbon-carbon bond length in graphene. For ZGNRs with a width below 50nm, indices in the range 6 to 235 have to be considered. In this range of indices the wave functions and the energy dispersion have been evaluated. It should be noted that structures wider than 50nm are also evaluated and the results show excellent agreement with those obtained from numerical simulation. Fig. 4.6 shows several wave functions for 125-ZGNR evaluated from two approximations proposed. As can be seen, the wave functions obtained by Eq. 28 are matched very well with the numerical calculations. The dispersion relation of some subbands for 125-ZGNR are shown in Fig. 4.7. Similar to the wave functions, the dispersion relations obtained by θ from Eq. 28, show well agreement with the numerical results.
An important conclusion that one can draw from these results is that the analytical approximation of θ presented in Eq. 28 is more accurate than the solution obtained by using a curve fitted θ, see Fig. 4.6 and Fig. 4.7. Also, the accuracy of the analytical method increases as the ZGNR index increases (see the energy dispersions for 6-ZGNR and 19-ZGNR in Fig. 4.4 and 125-ZGNR in Fig. 4.7).
As can be see in Fig. 4.2, this increase in accuracy is due to the fact that θ is relatively independent of changes in the wave-vector (kx) for large values of N.
In order to investigate the applicability of the proposed models, the optical matrix elements are derived analytically based on our models in 4.3. To evaluate the transition rules, we can also investigate the symmetry of the transition matrix element in Eq. 23. If the symmetry of this element spans the totally symmetric representation of the point group to which the unit cell belongs, then its value is not zero and the transition is allowed. Otherwise, the transition is forbidden. Assuming a uniform potential profile across the ribbon’s width, the subbands’ wave functions are either symmetric or antisymmetric along the y direction.
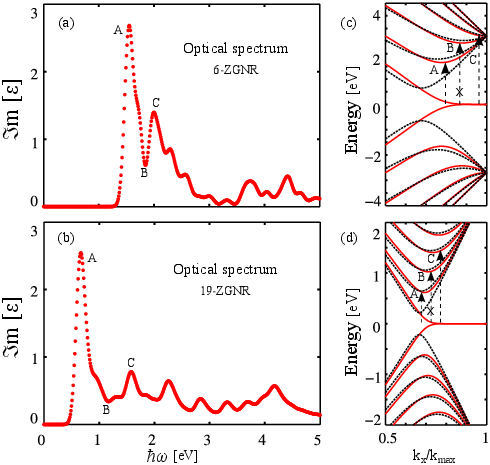
Figure 4.8: Dielectric function of (a) 6-ZGNR and (b) 19-ZGNR. The peaks are related to electronic band structure of (c) 6-ZGNR and (d) 19-ZGNR.
Considering the wave functions for 6-ZGNR and 19-ZGNR (Fig. 4.5), subbands corresponding to odd indices are symmetric, while those corresponding to even indices are antisymmetric. Therefore, the momentum matrix elements are non zero for transitions from the symmetric (antisymmetric) to the symmetric (antisymmetric) wave functions. This transition rule results in transitions from subbands with odd (even) to odd (even) indices in ZGNRs,[151] which confirms the result obtained from our analytical derivation of the wave functions and momentum matrix elements.
To demonstrate the applicability of our models the imaginary part of the dielectric function εi (Eq. 4) is calculated numerically for 6-ZGNR and 19-ZGNR (see Fig. 4.8(a) and Fig. 4.8(b)). Peaks in εi(ω) indicate absorptions of photons with energy ℏω. From the electronic band-structure in Fig. 4.8(c) it can be found that the peaks in εi(ω) are related to transitions from n=6 to n=8 (A), and n=6 to n=10 (C). The minimum designated as (B) is related to the transition from n=6 to n=9 which is forbidden according to the obtained transition rules. The same analysis exists for 19-ZGNR, see Fig. 4.8(b) and Fig. 4.8(d). Therefore, the allowed transitions are from odd to odd and even to even subband numbers, which is in agreement with our analytical derivation.
We presented two methods for analytical approximation of the discrete energies in ZGNRs. Relations for the wave functions and the energy dispersion show good agreement with those obtained from numerical calculations. Our simple approximation is applicable for a wide range of ZGNR indices from N=6 to N=500. While the results show good agreement for small N-ZGNRs, the accuracy increases for wider ZGNRs. The analytical approach presented here is used to drive transition rules. Our model shows that transitions from odd to odd and even to even subband numbers are allowed and that other transitions are forbidden in ZGNRs. The model is applicable for the evaluation of optical properties of ZGNRs such as dielectric response, absorption coefficient, and energy loss spectrum.


